Blending Google Analytics 4 (GA4) and Google Ads data in Looker Studio allows you to connect campaign costs and ad performance with on-site behavior and conversions. This gives you a complete view of ROI across campaigns.
In this guide, I’ll show you step-by-step how to blend GA4 and Ads data inside Looker Studio, with practical tips to avoid common mistakes.
Why Blend GA4 and Google Ads Data?
Both GA4 and Google Ads provide valuable insights — but separately, they don’t tell the full story:
- Google Ads → Cost, Clicks, Impressions, CPC, Campaigns.
- GA4 → Sessions, Bounce Rate, Conversions, Revenue, Engagement.
By blending them in Looker Studio, you can answer questions like:
- Which campaigns drive the most conversions at the lowest cost?
- What’s my ROAS (Return on Ad Spend) for each landing page?
- How does user behavior differ by campaign?
👉 Instead of switching between platforms, you get one dashboard with both cost + performance.
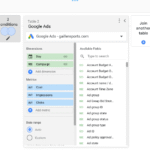
🛠 Step 1: Connect Data Sources
- Open Looker Studio.
- Click Create → Data Source.
- Add Google Analytics 4 (select your property).
- Add Google Ads (select your account).
You should now see both data sources available in your report.
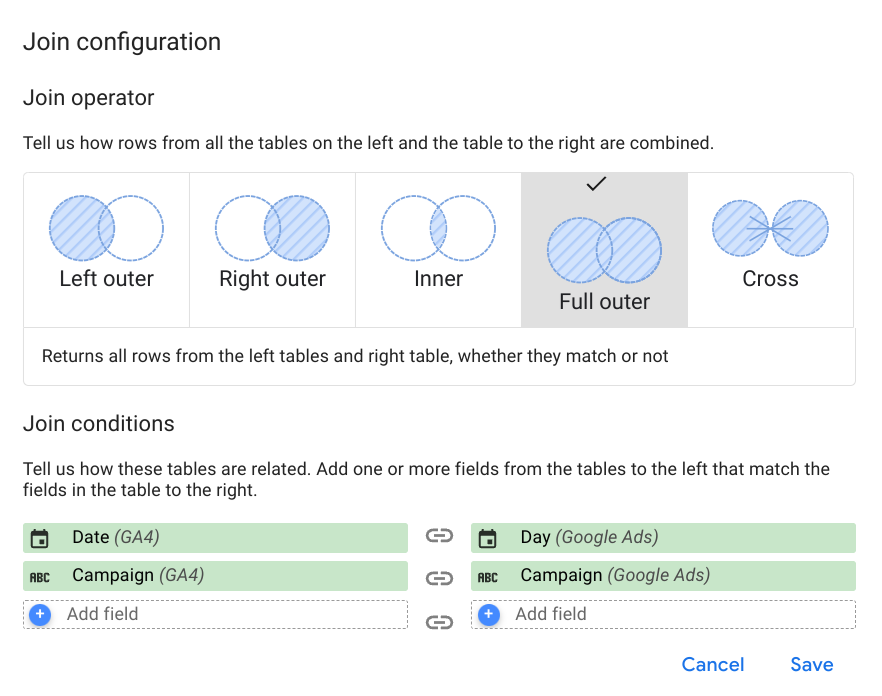
🔗 Step 2: Create a Blend
- Click Resource → Manage blends → Add a Blend.
- Select GA4 as the Primary Source.
- Add Google Ads as the Secondary Source.
👉 The join key (dimension) must be the same in both sources. Common join options are:
- Campaign
- Date
- Landing Page
⚠️ Important: Make sure naming is consistent. GA4 might show “Campaign Name” while Ads shows “Campaign.”
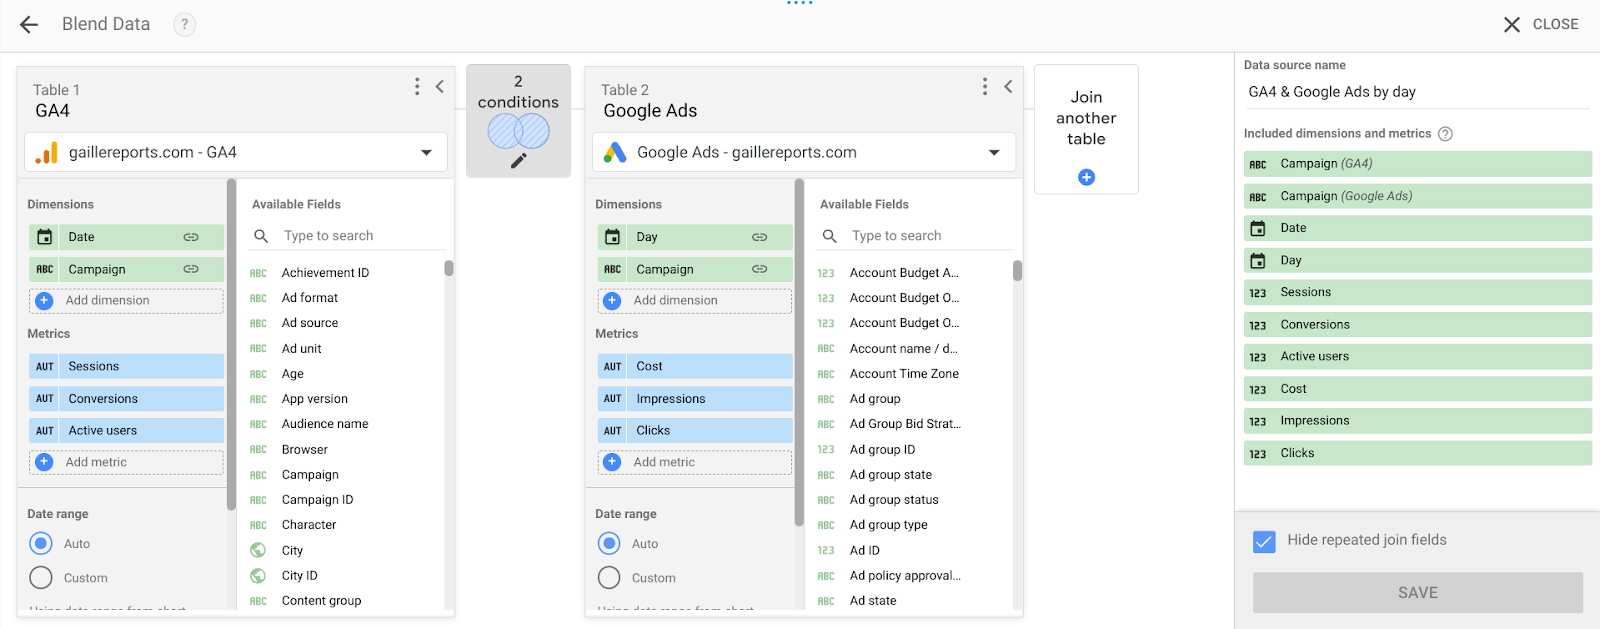
Step 3: Select Dimensions and Metrics
From GA4:
- Date
- Campaign
- Sessions
- Conversions
- Revenue
From Google Ads:
- Impressions
- Clicks
- Cost
- CPC
👉 Now, your blended table contains both cost + conversion data.
Step 4: Create Calculated Fields
To get real value, create calculated metrics:
Cost per Conversion
Cost / Conversions

ROAS (Return on Ad Spend)

Revenue / Cost

CTR (Click-Through Rate)

Clicks / Impressions
📈 Step 5: Visualize the Data
Now, build your dashboard:
- Table → Campaign, Impressions, Clicks, Cost, Conversions, ROAS.
- Time Series Chart → Cost vs. Conversions by Date.
- Bar Chart → Landing Page vs. ROAS.
Best Practices
- Match granularity: Always blend on the same level (e.g., Date + Campaign).
- Clean dimensions: Use
REGEXP_REPLACEto fix URL mismatches in landing pages. - Optimize performance: Avoid blending too many fields; it slows reports
By blending GA4 and Google Ads in Looker Studio, you can create a single source of truth for campaign performance. Instead of toggling between platforms, you’ll have cost + behavior + revenue in one dashboard.
This setup empowers marketers to track ROI, optimize campaigns, and prove value with clear reporting.